


![]()
Relevant publications:
Measuring and Reporting High Quality Factors of Inductors Using Vector
Network Analyzers
William B. Kuhn and Adam P. Boutz
IEEE Transactions on Microwave Theory and Techniques, pp. 1046 - 1055,
April 2010
Investigation of Q-curve Dip in GaAs on-chip Inductors
Hartter, M.A 2004
![]()
High Accuracy Q Measurements
High-order filters are most often characterized by a "Q-factor,"
a descriptor of how steep an individual filter's frequency-response is.
"High" or "sharp" Q-factors imply a very distinct difference between the
"passband" of a filter and its corresponding "stopband," with a very
short frequency range over which the passband becomes the stopband.
A low-Q filter may have a magnitude response roll-off that is very
shallow, attenuating a signal gradually toward 0 dB and beyond for
frequencies outside of a filter's passband.
In the world of radio frequencies, Q-factors of a filter (over a varying
frequency range) can be illustrated using a Smith chart. The image
below illustrates the frequency-dependent impedance for filters of
differing Q-factors.
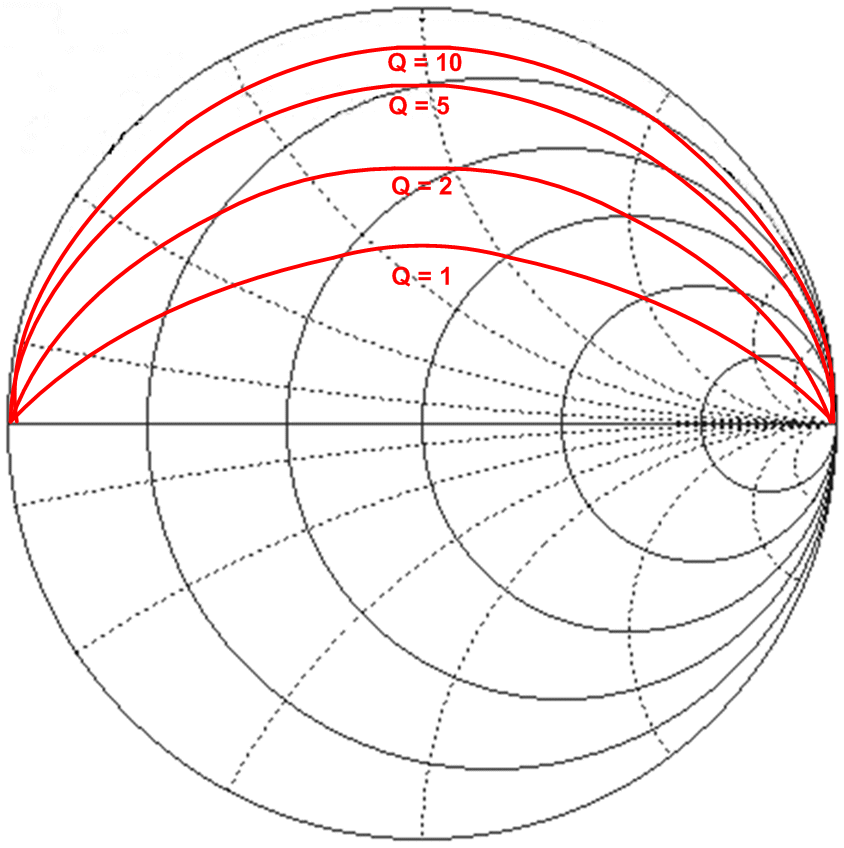
Here, the red line marked "Q=10" represents the filter with the steepest roll-off in its frequency response, and hence, the highest Q-factor.
Calibrating for Q-Factor Measurements
In order to take high-accuracy measurements of an RF system,
filters included, test equipment calibration is key. All
cables, microstrip lines, connectors and any other part of an RF circuit
is responsible for signal-loss to some degree. As a culmination of
the effects of all the devices involved in taking RF measurements, it
becomes increasingly difficult to take measurements that truly
represent a given RF system.
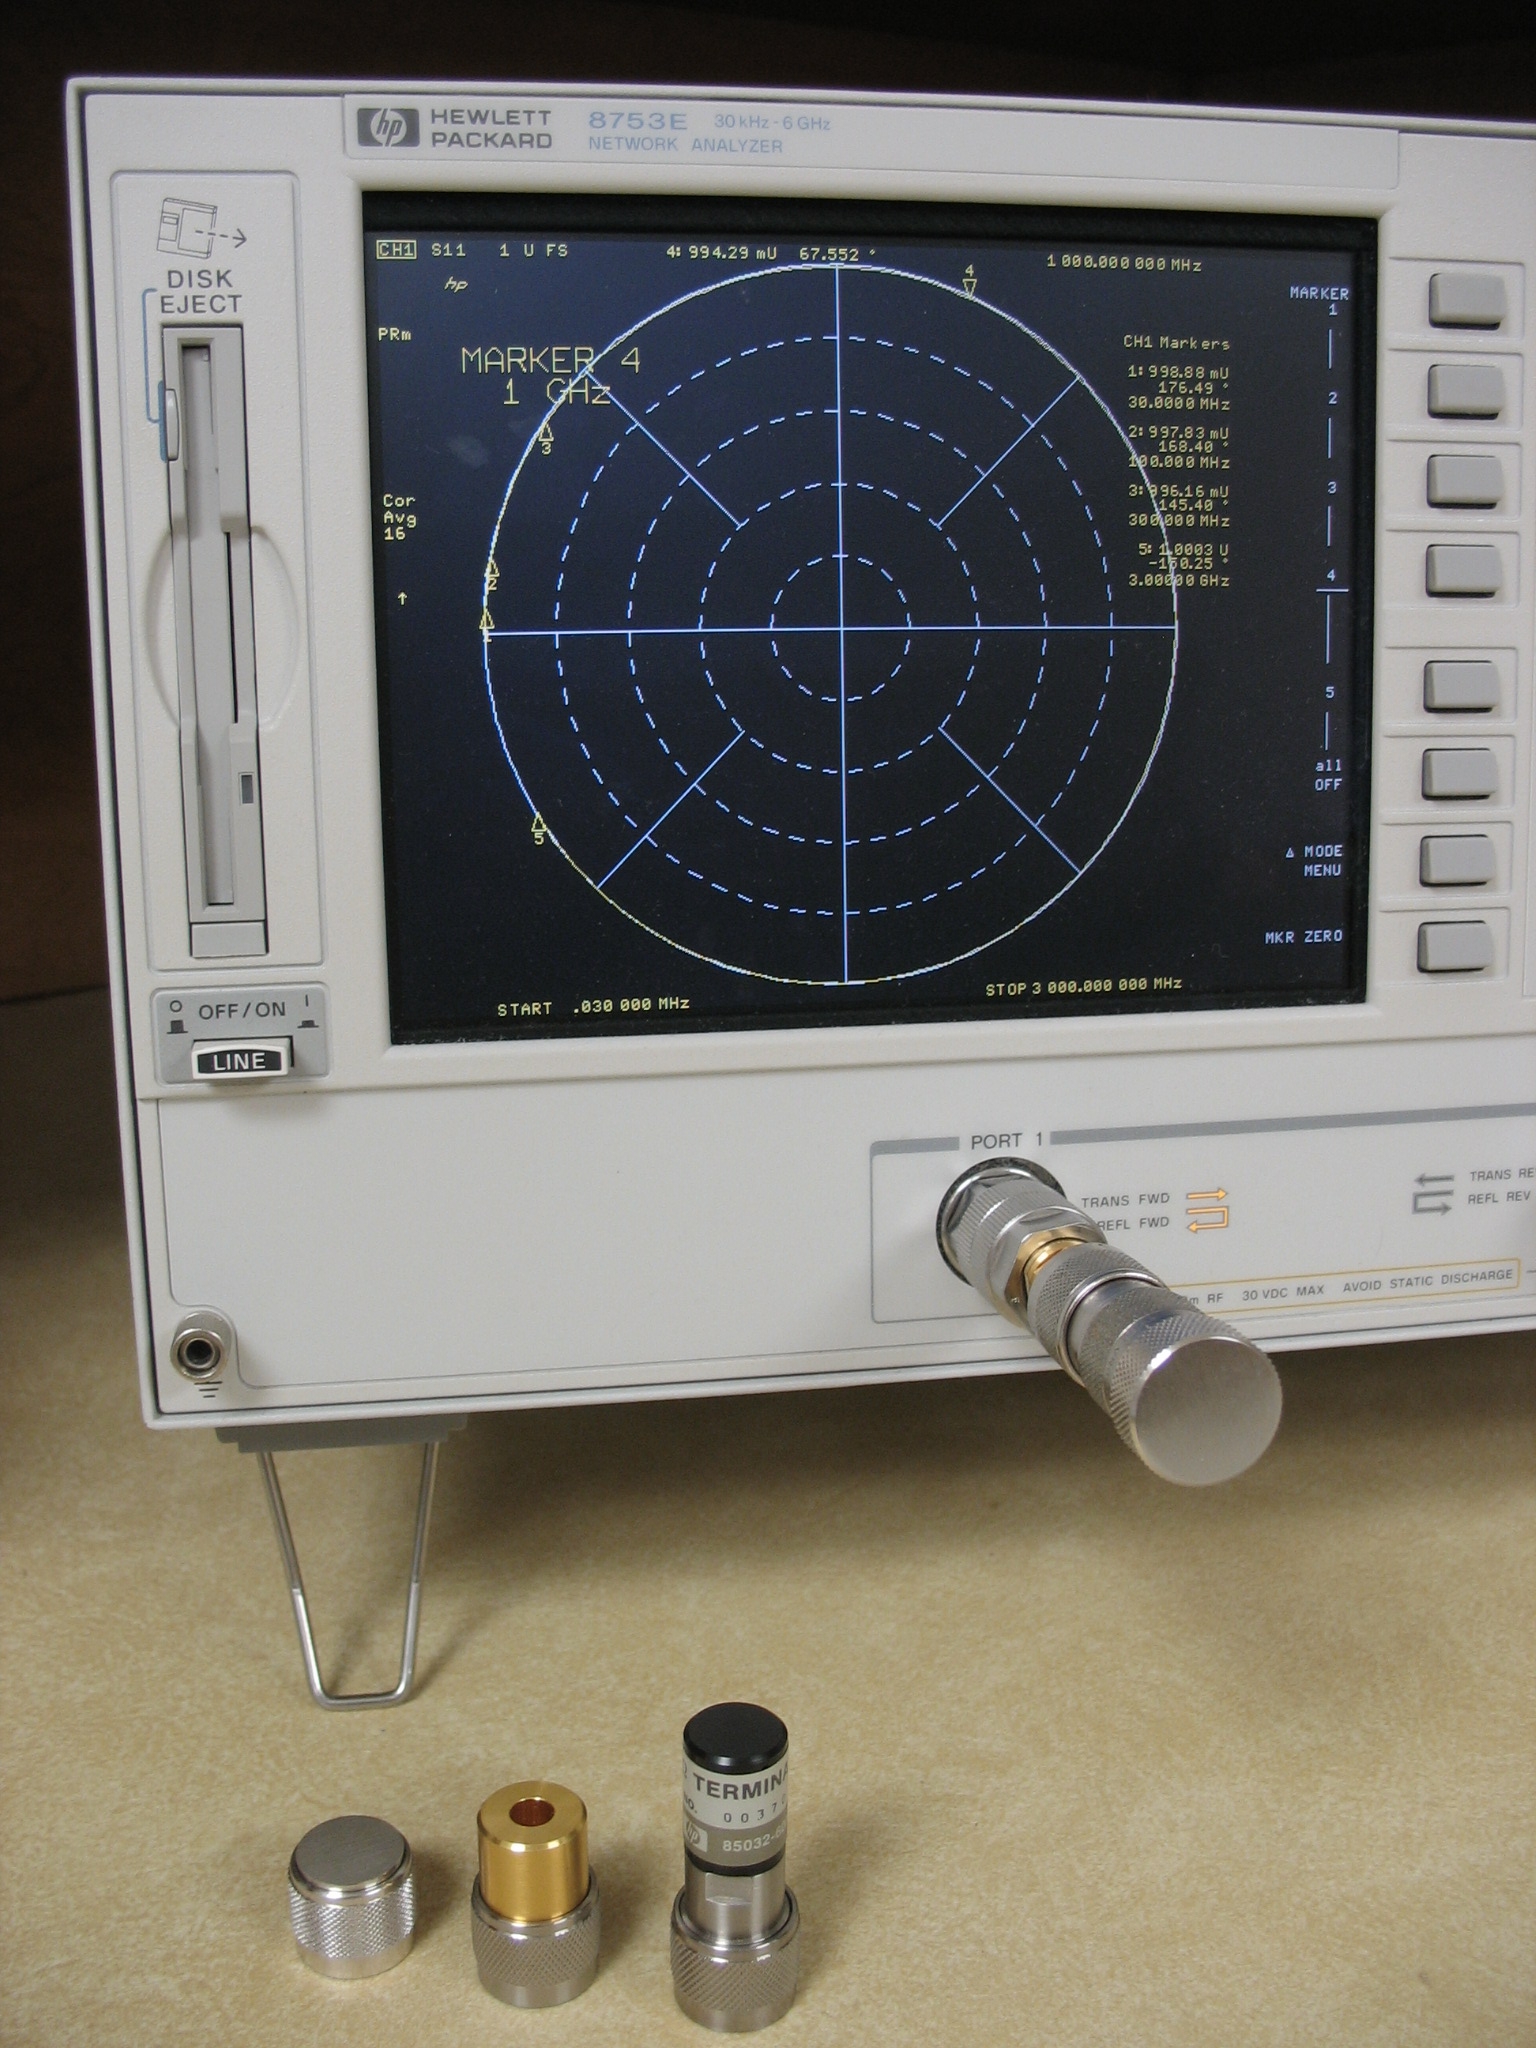
A well-calibrated Network Analyzer is photographed below. Notice
the yellow line, barely visible, that outlines the outer circle seen on
the device's screen. This yellow line represents individual
datapoints (over a programmable frequency range) and their corresponding
s-parameter value, depending on the type of measurement being taken.
When this same Network Analyzer is poorly calibrated, this yellow circle is far off of its mark, representing a large offset value for each datapoint's s-parameter value. Observe the following image, representing this phenomenon.
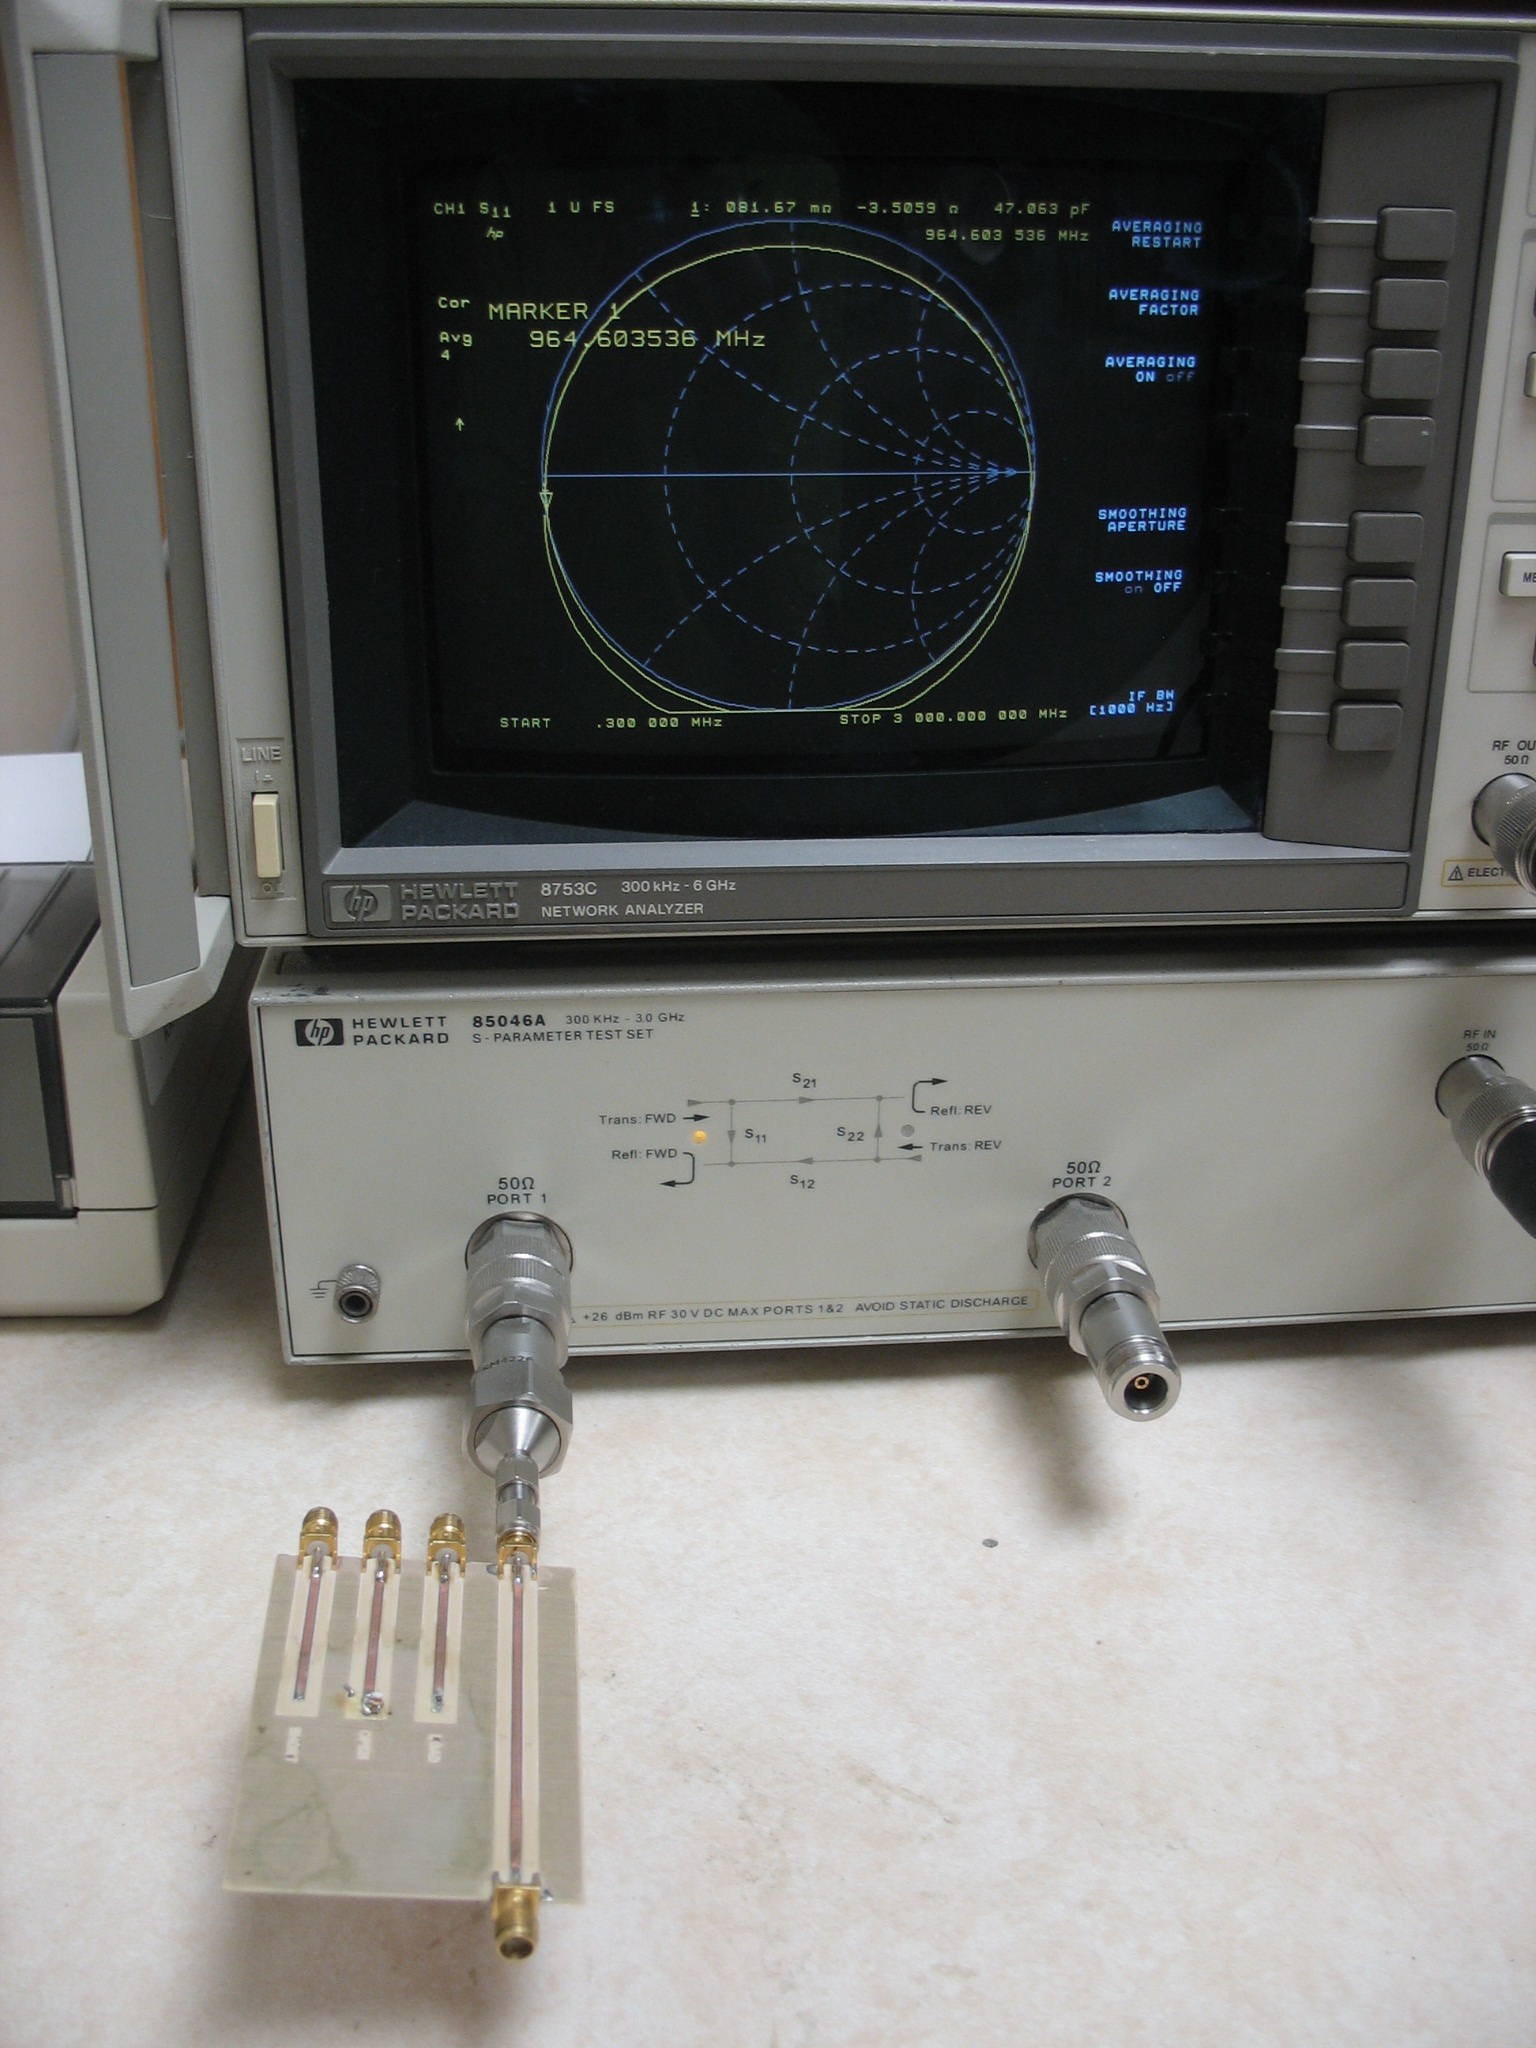
Note how this offset in calibration was introduced by the strip-line on the RF circuit board. If not properly taken into account, signal lines, as well as connectors and other "transmission lines," will introduce errors in measurements that do not accurately represent the performance characteristics of an RF system under test.